
テーブルウィジェット
最終更新日: 03 年 2024 月 XNUMX 日テーブル ウィジェットを使用すると、複数のリソース間で現在のデータポイント値を比較できます。 このウィジェットは、さまざまなリソース タイプ間でパフォーマンスと容量のメトリックを比較するのに役立ちます。 テーブル ウィジェットを使用すると、アラート予測を有効にできます。 詳細については、次を参照してください。 アラート予測.
In the table widget, you can configure custom and dynamic tables. You can view the resource property and instance description in the table widget.
注: テーブル ウィジェットは、ビッグ ナンバー ウィジェットのように、大きな数字のグリッドと見なすこともできます。 詳細については、次を参照してください。 ビッグナンバーウィジェット.
テーブルオプション
テーブル ウィジェットには XNUMX つの構成オプションがあります。
| オプション | 説明 |
| カスタム | テーブル内の指定されたリソースの静的データポイントを選択できます。 このオプションは、監視しているデータの数と揮発性が比較的低い場合に使用します。 |
| ダイナミック | グロブ式に基づいて、最初に構成されたデータポイント (列) で使用可能な上位下位 10、上位または下位 25、またはすべてのアクティブなインスタンスを表示します。 このオプションは、監視しているデータの数と揮発性が比較的高い場合に使用します。 このオプションは、どのデータポイントとデバイスが CPU や帯域幅などの使用可能なリソースを最も多くまたは最も少なく使用しているかをリアルタイムで把握したい場合に最適です。 |
テーブル ウィジェットを作成するための要件
テーブル ウィジェットを作成するには、次のことを行う必要があります。
- Know what you want to monitor (resources or datasource instances) and what about them you want to monitor (datapoints)
- テーブル ウィジェットで作成するデータポイント シノニム マッピングを理解する
- To view resource property in the table widget, you must add at least one datapoint before configuring the resource property data
カスタム テーブルの構成
1. Create a Table widget. For more information, see ウィジェットの作成.
2. Complete the Basic Information fields. For more information, see 標準ウィジェット設定の構成.
3. In the Table Options settings, select ダイナミック.
- (オプション) トグルオン アラート予測を有効にする データポイントが指定されたアラートしきい値を超えるまでの予測日数を表示するには、次の手順を実行します。
- [予測方法] フィールドで、 ベストフィットのライン or 95%信頼.
- 予測トレーニングの基礎 ドロップダウンで、将来の傾向を予測するために使用する時間範囲を選択します。
- 「までの日数」アラートの表示オプション ドロップダウンで、警告、エラー、または重大なアラートがトリガーされるまでの日数を表示するかどうかを選択します。
- 含めるための最小の信頼度 dropdown, select a percentage to specify the minimum level of confidence in LogicMonitor’s algorithm must have to predict an alert.
たとえば、70% の最小信頼度を選択した場合、LogicMonitor の予測アルゴリズムは、予測を発行する前に、将来のアラートを少なくとも 70% 確実にする必要があることを意味します。
注: このオプションは、テーブル ウィジェットの [アラートまでの日数] という表示列として表示され、対応するデータポイントがアラートのしきい値を超えるまでの日数を示します。 データポイントがすでにアラートをトリガーしている場合、アラートの重大度を示すアイコンがこの列に表示されます。
4. In the Columns settings, select + レコードを追加 列を追加します。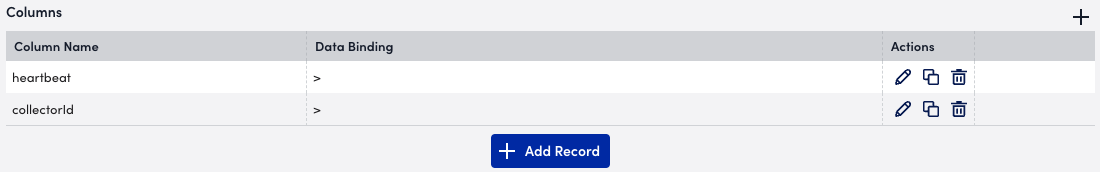
5. To the right of Datapoints, select the Plus (+) アイコンをクリックして、列へのデータポイントの追加を開始します。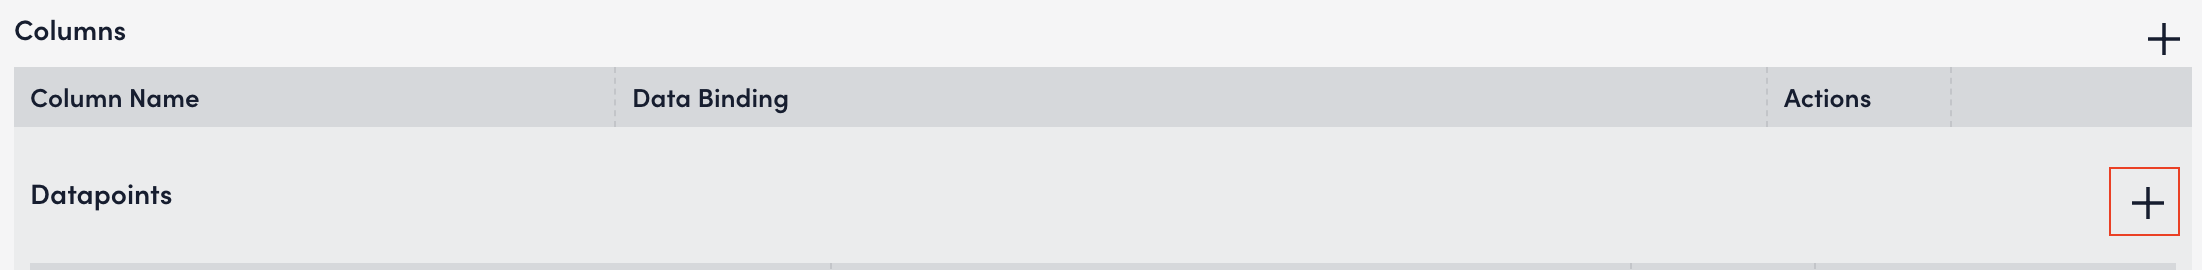
- データソース名 field, enter the name of a datasource and select it from the results list or enter a * glob expression to select all datasources.
- データポイント名 field, enter the name of a datapoint and select it from the results list or enter a * glob expression to select all datapoints.
6。 選択 申し込む.
7。 の中に 列名 field, enter a name for this column.
注: 顧客の名前などの列ラベルにカスタム表示トークンを使用して、ウィジェットやダッシュボードをコピーするときに情報を再利用します。
- (オプション) Unit Label field, enter a unit of measurement for the datapoint.
測定単位は、列の各セルの値に追加されます。
- (オプション) トグルオン アラート予測を有効にする このデータポイントの [テーブル オプション] 設定で構成したアラート予測を有効にします。
- (オプション) [丸め] フィールドで、データポイントの小数丸めオプションを選択します。

- (オプション) トグルオン データポイントで式を実行選択 データポイントを挿入 必要な数のデータポイントを挿入してから、Groovy スクリプトを入力します。 詳細については、次を参照してください。 データポイントで式を実行.
8. When finished configuring the column datapoint, select 申し込む.
必要な数のデータポイントを追加し続けます。
9. In the Rows settings, select + レコードを追加 行の追加を開始します。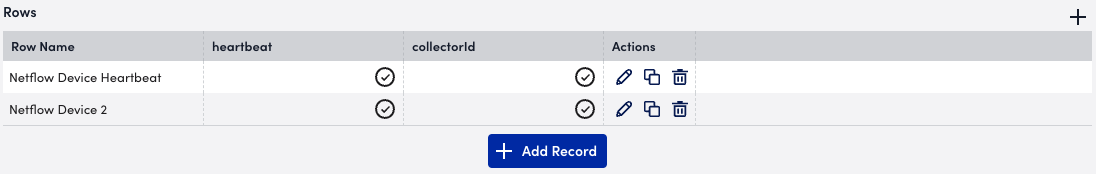
- リソースグループ名 field, enter the resource group name and select it from the results list or enter a * glob expression to select all resource groups.
- リソース名 field, enter the resource name and select it from the results list or enter a * glob expression to select all resources associated with the selected resource group.
- 行名 field, enter a name for this row.
行ラベルにカスタム表示トークンを使用して、ウィジェットとダッシュボードをコピーするときに情報を再利用します。
10. When finished configuring rows, select 申し込む.
必要な数の行データポイントを追加し続けます。
注: データが必要な行ごとに、そのデータを提供するためのデータポイント シノニムが少なくとも XNUMX つ存在する必要があります。そうでない場合、行は空白になります。
11. (オプション) ページ毎の結果 field, select the number of results per page you want to show in the Table widget.
12. Complete the standard widget configurations, and then select Save。 詳細については、を参照してください。 標準ウィジェット設定の構成.
動的テーブルの構成
1. Create a Table widget. For more information, see ウィジェットの作成.
2. Complete the Basic Information fields. For more information, see 標準ウィジェット設定の構成.
3. In the Table Options settings, select ダイナミック.
4. (オプション) トグルオン アラート予測を有効にする データポイントが指定されたアラートしきい値を超えるまでの予測日数を表示するには、次の手順を実行します。
- [予測方法] フィールドで、 ベストフィットのライン or 95%信頼.
- 予測トレーニングの基礎 ドロップダウンで、将来の傾向を予測するために使用する時間範囲を選択します。
- 「までの日数」アラートの表示オプション ドロップダウンで、警告、エラー、または重大なアラートがトリガーされるまでの日数を表示するかどうかを選択します。
- 含めるための最小の信頼度 ドロップダウンで、パーセンテージを選択して、アラートを予測するために LogicMonitor のアルゴリズムに必要な最小信頼レベルを指定します。
たとえば、70% の最小信頼度を選択した場合、LogicMonitor の予測アルゴリズムは、予測を発行する前に、将来のアラートを少なくとも 70% 確実にする必要があることを意味します。
注: このオプションは、テーブル ウィジェットの [アラートまでの日数] という表示列として表示され、対応するデータポイントがアラートのしきい値を超えるまでの日数を示します。 データポイントがすでにアラートをトリガーしている場合、アラートの重大度を示すアイコンがこの列に表示されます。
5. In the Active Items To Display field, choose the number of top or bottom items to display in the dynamic Table widget.
6. In the Columns settings, select + レコードを追加 列を追加します。
- データソース名 field, enter the name of a datasource and select it from the results list or enter a * glob expression to select all datasources.
- データポイント名 field, enter then name of a datapoint and select it from the results list or enter a * glob expression to select all datapoints.
7. In the Column Name field, enter a name for this column.
注: 顧客の名前などの列ラベルにカスタム表示トークンを使用して、ウィジェットやダッシュボードをコピーするときに情報を再利用します。
8. (オプション) 単位ラベル field, enter a unit of measurement for the datapoint.
測定単位は、列の各セルの値に追加されます。
9.(オプション) トグルオン アラート予測を有効にする このデータポイントの [テーブル オプション] 設定で構成したアラート予測を有効にします。
10. (オプション) 丸め field, choose a decimal rounding option for the datapoint.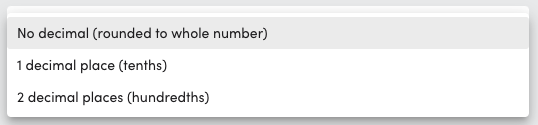
11. (オプション) トグルオン データポイントで式を実行選択 データポイントを挿入 必要な数のデータポイントを挿入してから、Groovy スクリプトを入力します。 詳細については、次を参照してください。 データポイントで式を実行.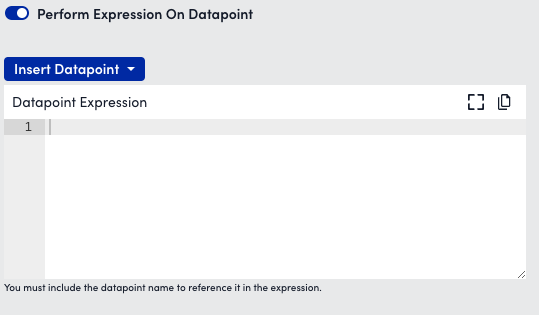
12. (オプション) トグルオン 色付きのバーを表示 環境の正常性を一目で確認できるように、指定されたしきい値に基づいてデータポイントの値を色分けし、次の手順を実行します。
13. オンに切り替えます パーセンテージで表示 セルの値の横にパーセンテージを表示します。
- 最小 field, enter a minimum percentage.
- 最大 field, enter a maximum percentage.
14. Configure the thresholds for the colored bars (red, orange, and yellow).
たとえば、データポイント セルが 90% または 85% のしきい値を超えた場合に、そのセルを赤またはオレンジで強調表示するように選択します。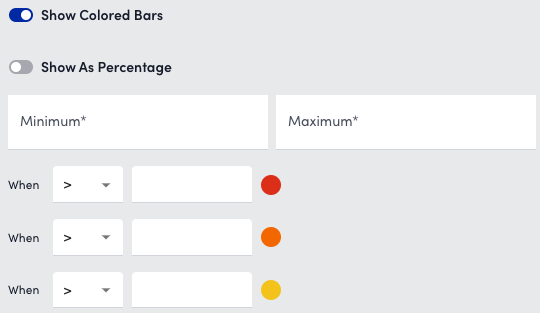
15. When finished configuring the column datapoint, select 申し込む.
必要な数の列データポイントを追加し続けます。
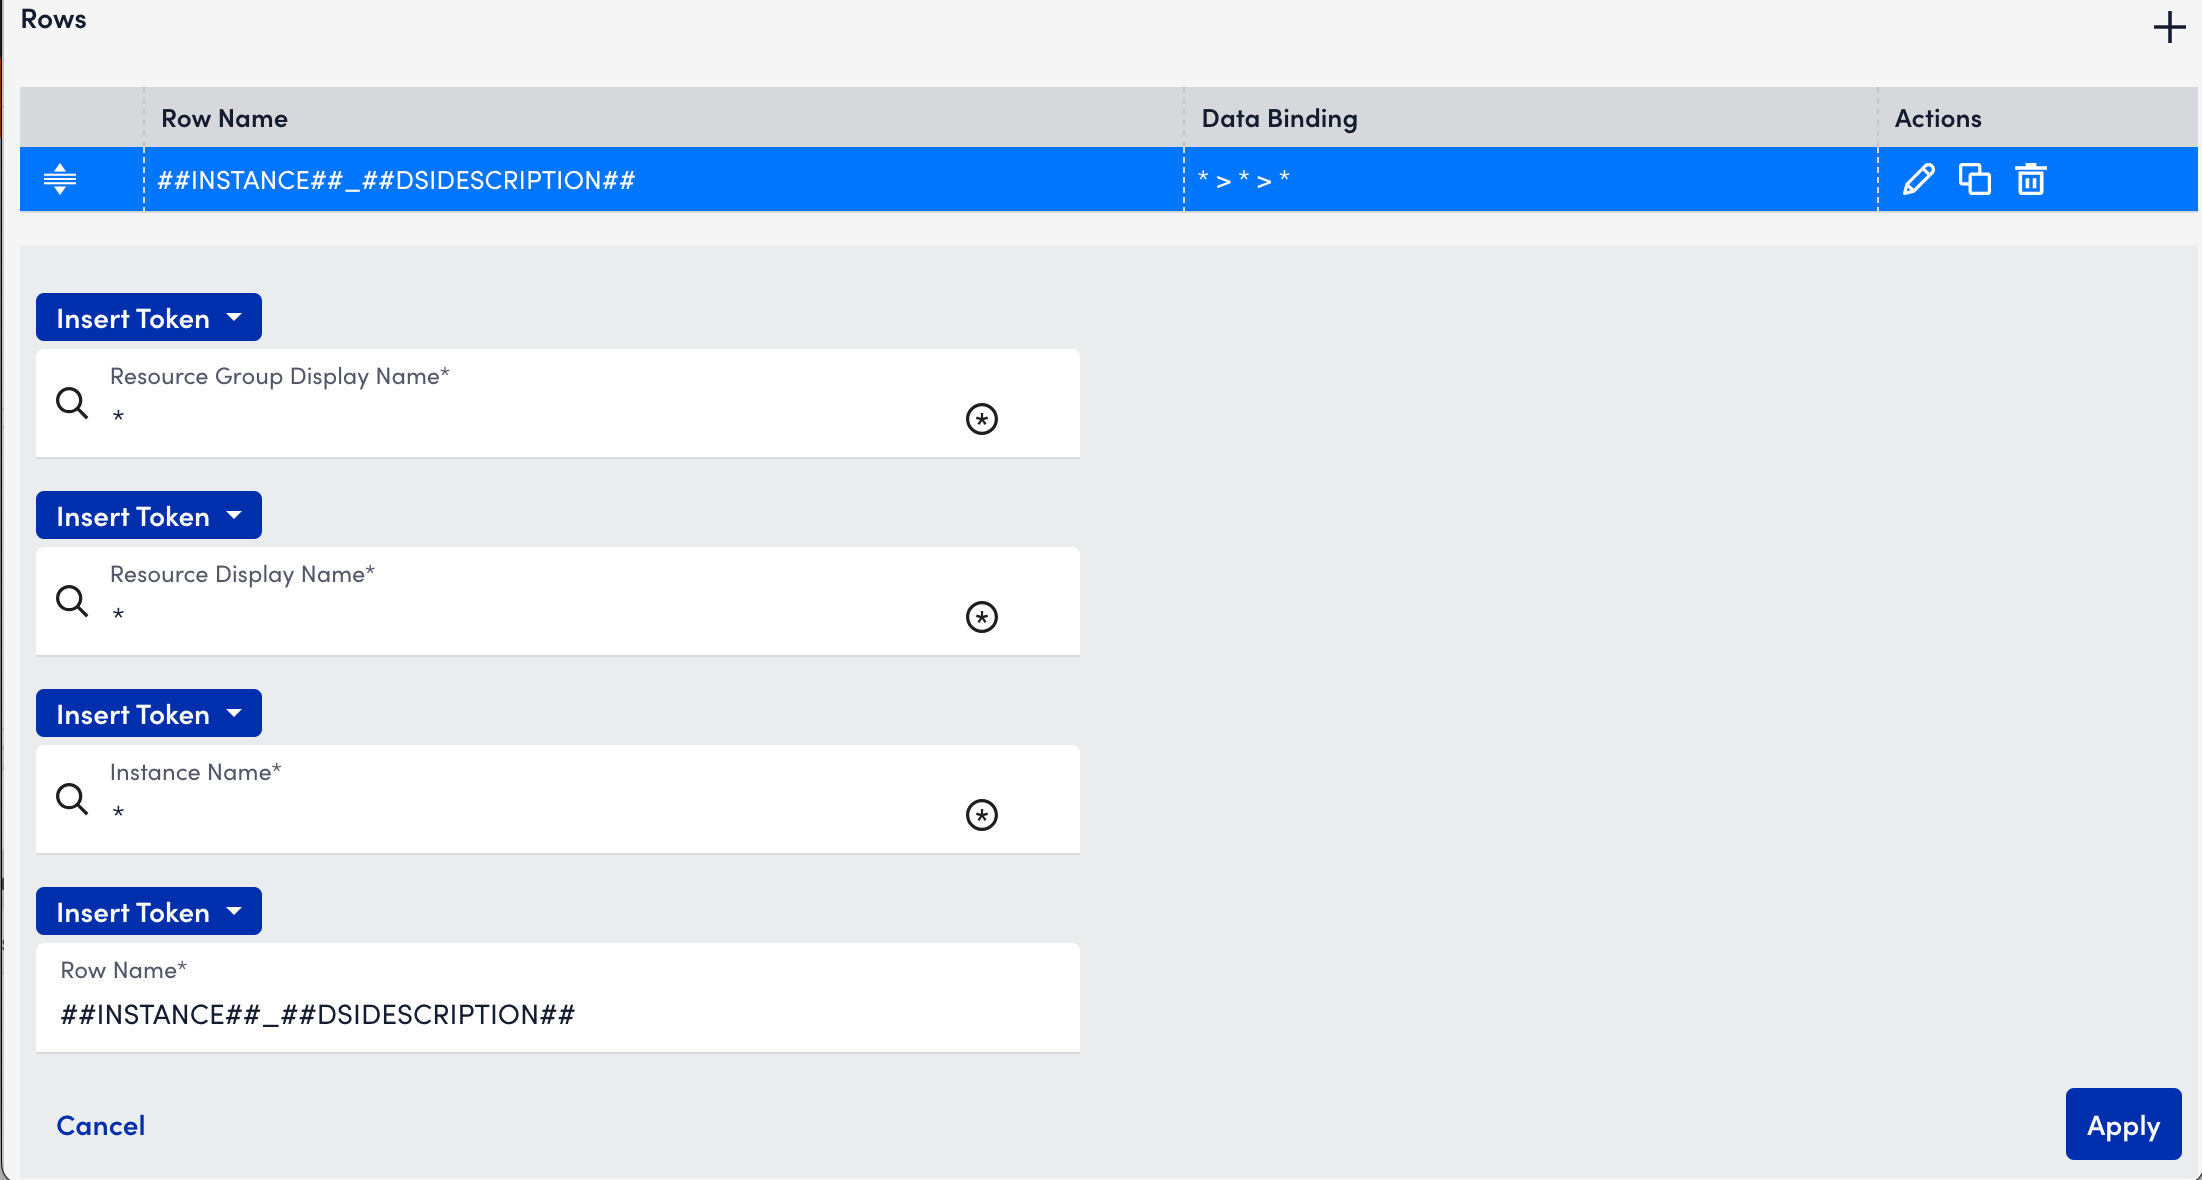
16. In the Rows settings, select + レコードを追加 行の追加を開始します。
- Resource Group Display Name field, enter the resource group name and select it from the results list or enter a * glob expression to select all resource groups.
- リソースの表示名 field, enter a resource name and select it from the results list or enter a * glob expression to select all resources associated with the selected resource group.
17。 の中に 行名 field, enter a name for this row.
Use the following custom display tokens for the row label to reuse information when copying widgets and dashboards:
- ##RESOURCENAME##- Displays the resource name
- ##INSTANCE##- Displays the instance name
- ##DSIDESCRIPTION##- Displays the instance description
Note: The ##DSIDESCRIPTION## token is supported only for Dynamic Tables.
18. When finished creating the row, select 申し込む.
必要な数の行データポイントを追加し続けます。
注: データが必要な行ごとに、そのデータを提供するためのデータポイント シノニムが少なくとも XNUMX つ存在する必要があります。そうでない場合、行は空白になります。
19. (オプション) [ページごとの結果] フィールドで、テーブル ウィジェットのページごとに表示する結果の数を選択します。
20. Complete the standard widget configurations, and then select Save。 詳細については、を参照してください。 標準ウィジェット設定の構成.
Viewing Resource Property
- 案内する Dashboards > Add Widget.
- ウィジェットを追加 パネル、選択 表。
- 選択 レコードを追加 to add datapoints.
Note: You must add a minimum of one datapoint. For information on adding datapoint, see 動的テーブルの構成.
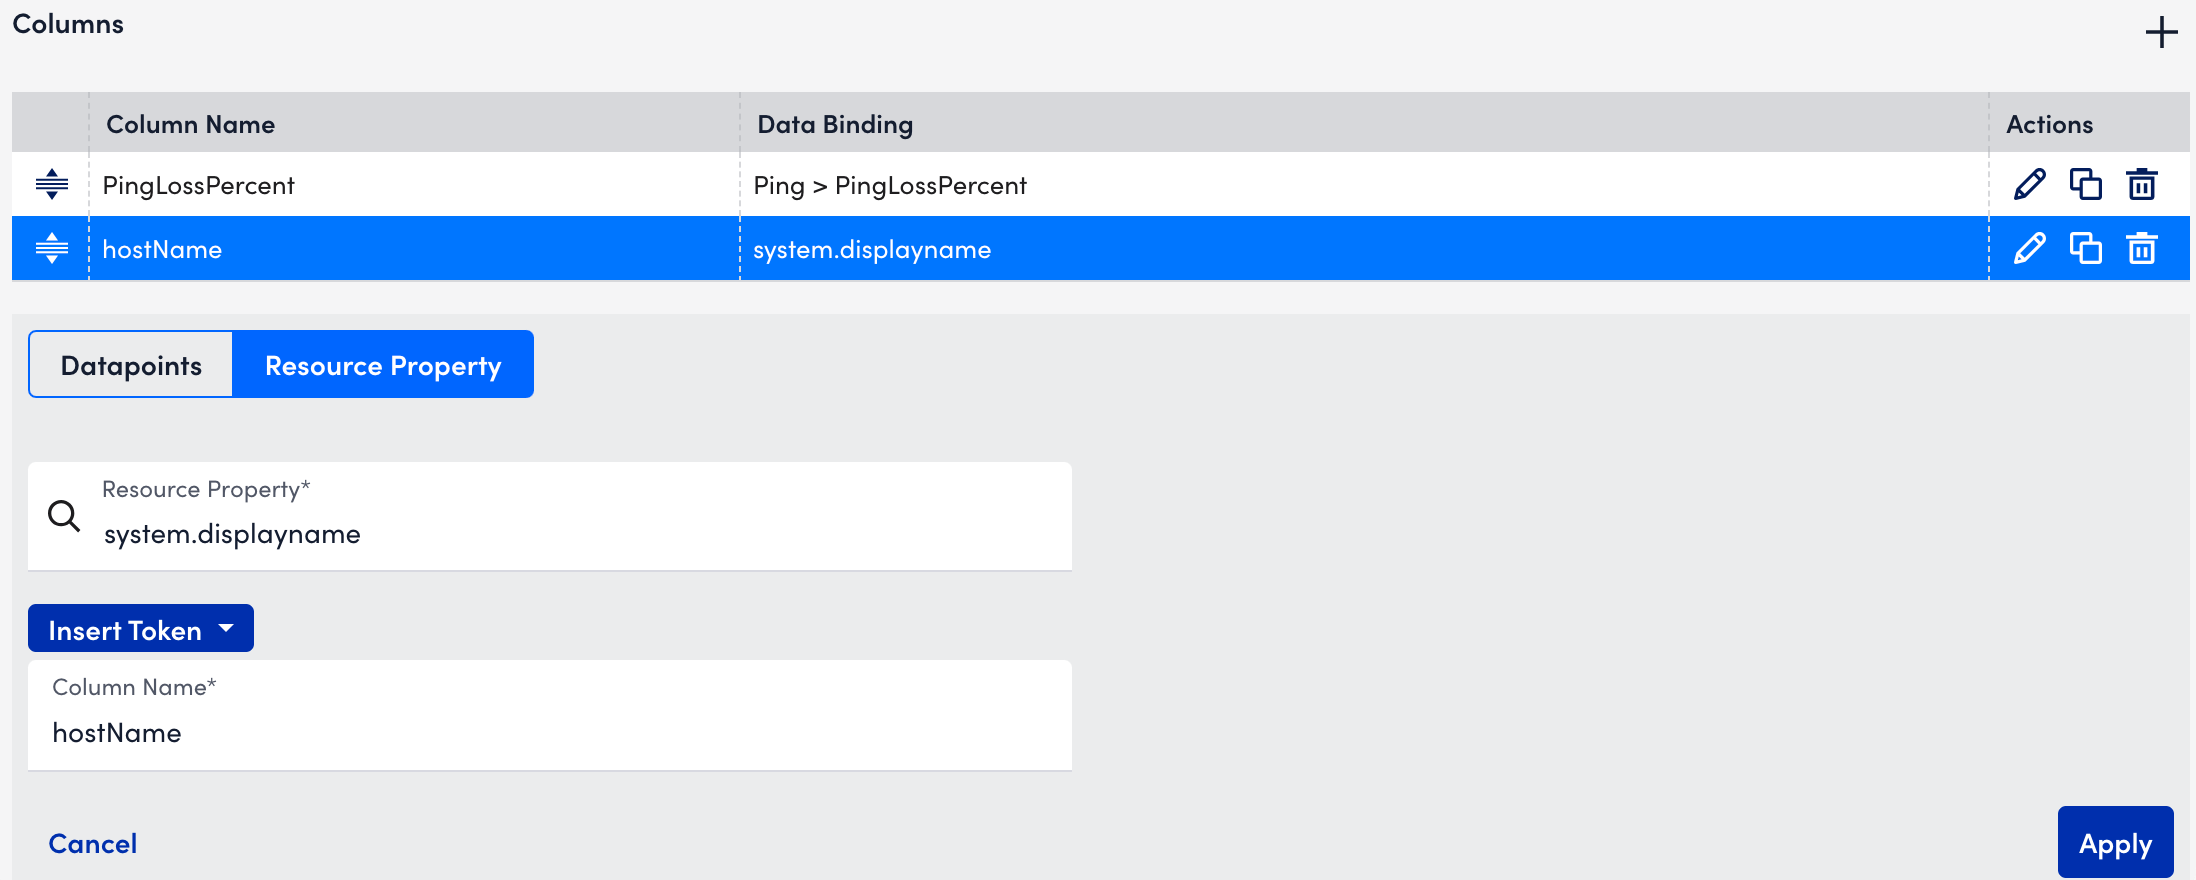
Once you add the datapoint, the Resource Property option will be enabled. - コラム settings, select Resource Property.
- 行 settings, enter the following details:
- Resource Group Display Name: Enter or search the required resource group name.
- リソースの表示名: Enter or search the required resource name.
- インスタンス名: Enter the required instance name.
- 選択 申し込む.
- 選択 Save.


データポイントで式を実行
Groovy スクリプトを埋め込んで、データポイントで式を実行できます。 データポイントで式を実行する際に留意すべき点がいくつかあります。
- テーブルに追加したすべてのリソースに適用できないデータポイントを選択している場合は、代替データソースを追加することを検討してください。 代替データソースが追加され、プライマリ データソースがテーブル内のリソースに適用されない場合、代替データソースが使用されます。 列ごとに最大 5 つの代替データソースを追加できます。
たとえば、4 台の Linux サーバーと 1 台の Windows サーバーの CPU 使用率を比較する場合、プライマリ データソースを「NetSNMPCPUwithCores」に設定し、代替データソースを「WinCPU」に設定します。 - マルチインスタンス データソースのデータポイントを選択すると、 インスタンスを選択 ボタン。 これにより、テーブルのデバイス行ごとにインスタンスを選択するオプションが提供されます。または、XNUMX つの行でインスタンスを選択して、 この列のセルに適用 すべてのデバイスで同じインスタンスのデータポイント値を確認するオプション。
- 列データポイントが追加されると、そのデータポイントに属するすべてのリソースのデータポイントの右側にチェック マークが表示されます。 選択したデータポイントがリソースに存在しない場合、テーブル内の関連する行は空白で表示されます。
表の構成は、各リソースについてどのデータポイント値が表示されるかを示します。